Introduction
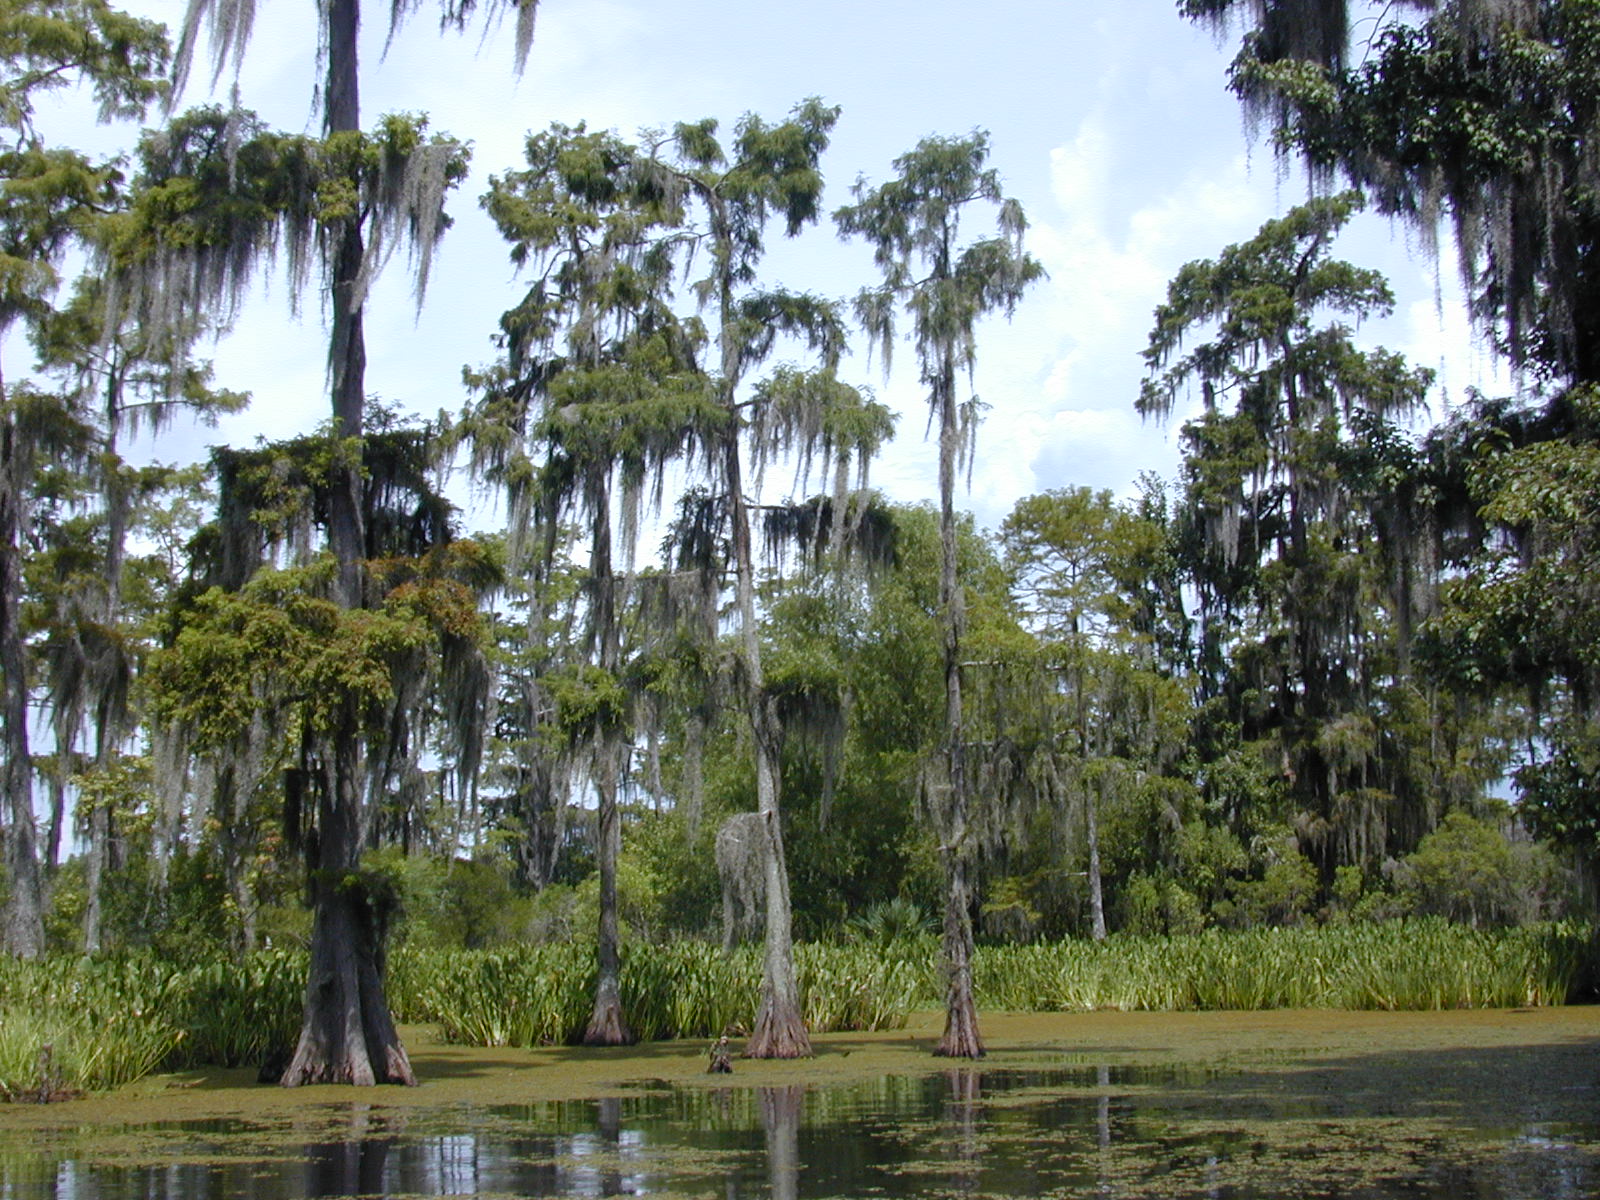
Photos courtesy of Jan Kronsell, 2004, via Wikimedia Commons
This region is a fantastic choice for groups unsure on the direction they wish to take, as it provides the most potential options. The site includes the metropolis of New Orleans, agricultural conversion, coastal wetlands and fisheries issues, as well as oil development. Natural disturbances (Hurricane Katrina) as well as anthropogenic impacts (such as the BP oil rig explosion, rising sea-levels) are important in the region. Tourism, seafood production, and potentially biofuels, also play a role.
Furthermore, the vast amount of information available makes it unlikely that data limitations will be a huge problem for you working here. A wide range of mapping products are available on-line from various agencies, along with numerous government and university reports and long-term datasets, many of which are excellent, abundant, and freely-available if you search for them.
Background
Energy/Resources: Renewable Energy Largest Solar Project U.S. Energy Information Administration Wildlife Agency Forest Disturbance
Agriculture/Aquaculture: Louisiana State University Biofuel Agriculture Research Eat Safe Louisiana Louisiana Seafood Promotion & Marketing Board Doing Citrus Right
Conservation/Ecology: Plan to Save the Coastline Gulf Ecosystem in Crisis Gulf Oil Spill History of Wetlands and Restoration Agency for the Coastal Wetlands Planning, Protection and Restoration Act Louisiana Range Disease Clusters Oil damage marine community Challenge to Louisiana’s Oil Industry Exxon Valdez Oil Spill The Economist: Blooming horrible Disaster Management Climate Map Mississippi River Delta National Geographic: Hurricane Katrina Wetland Damage Who’s to Blame: An Environmental Lawsuit and Reader’s response Natural Infrastructure and Ecosystem Services in Federal Decision-Making Vegetation development reveals social differences How to Save a Sinking Coast The Gulf, Still at Risk BP’s Missing Oil Found
Society/Urban: NY Times: New Orleans, Jungleland? Losing Trees? BP’s Silent Disaster National Map of Bike Lanes
Basic Geodata
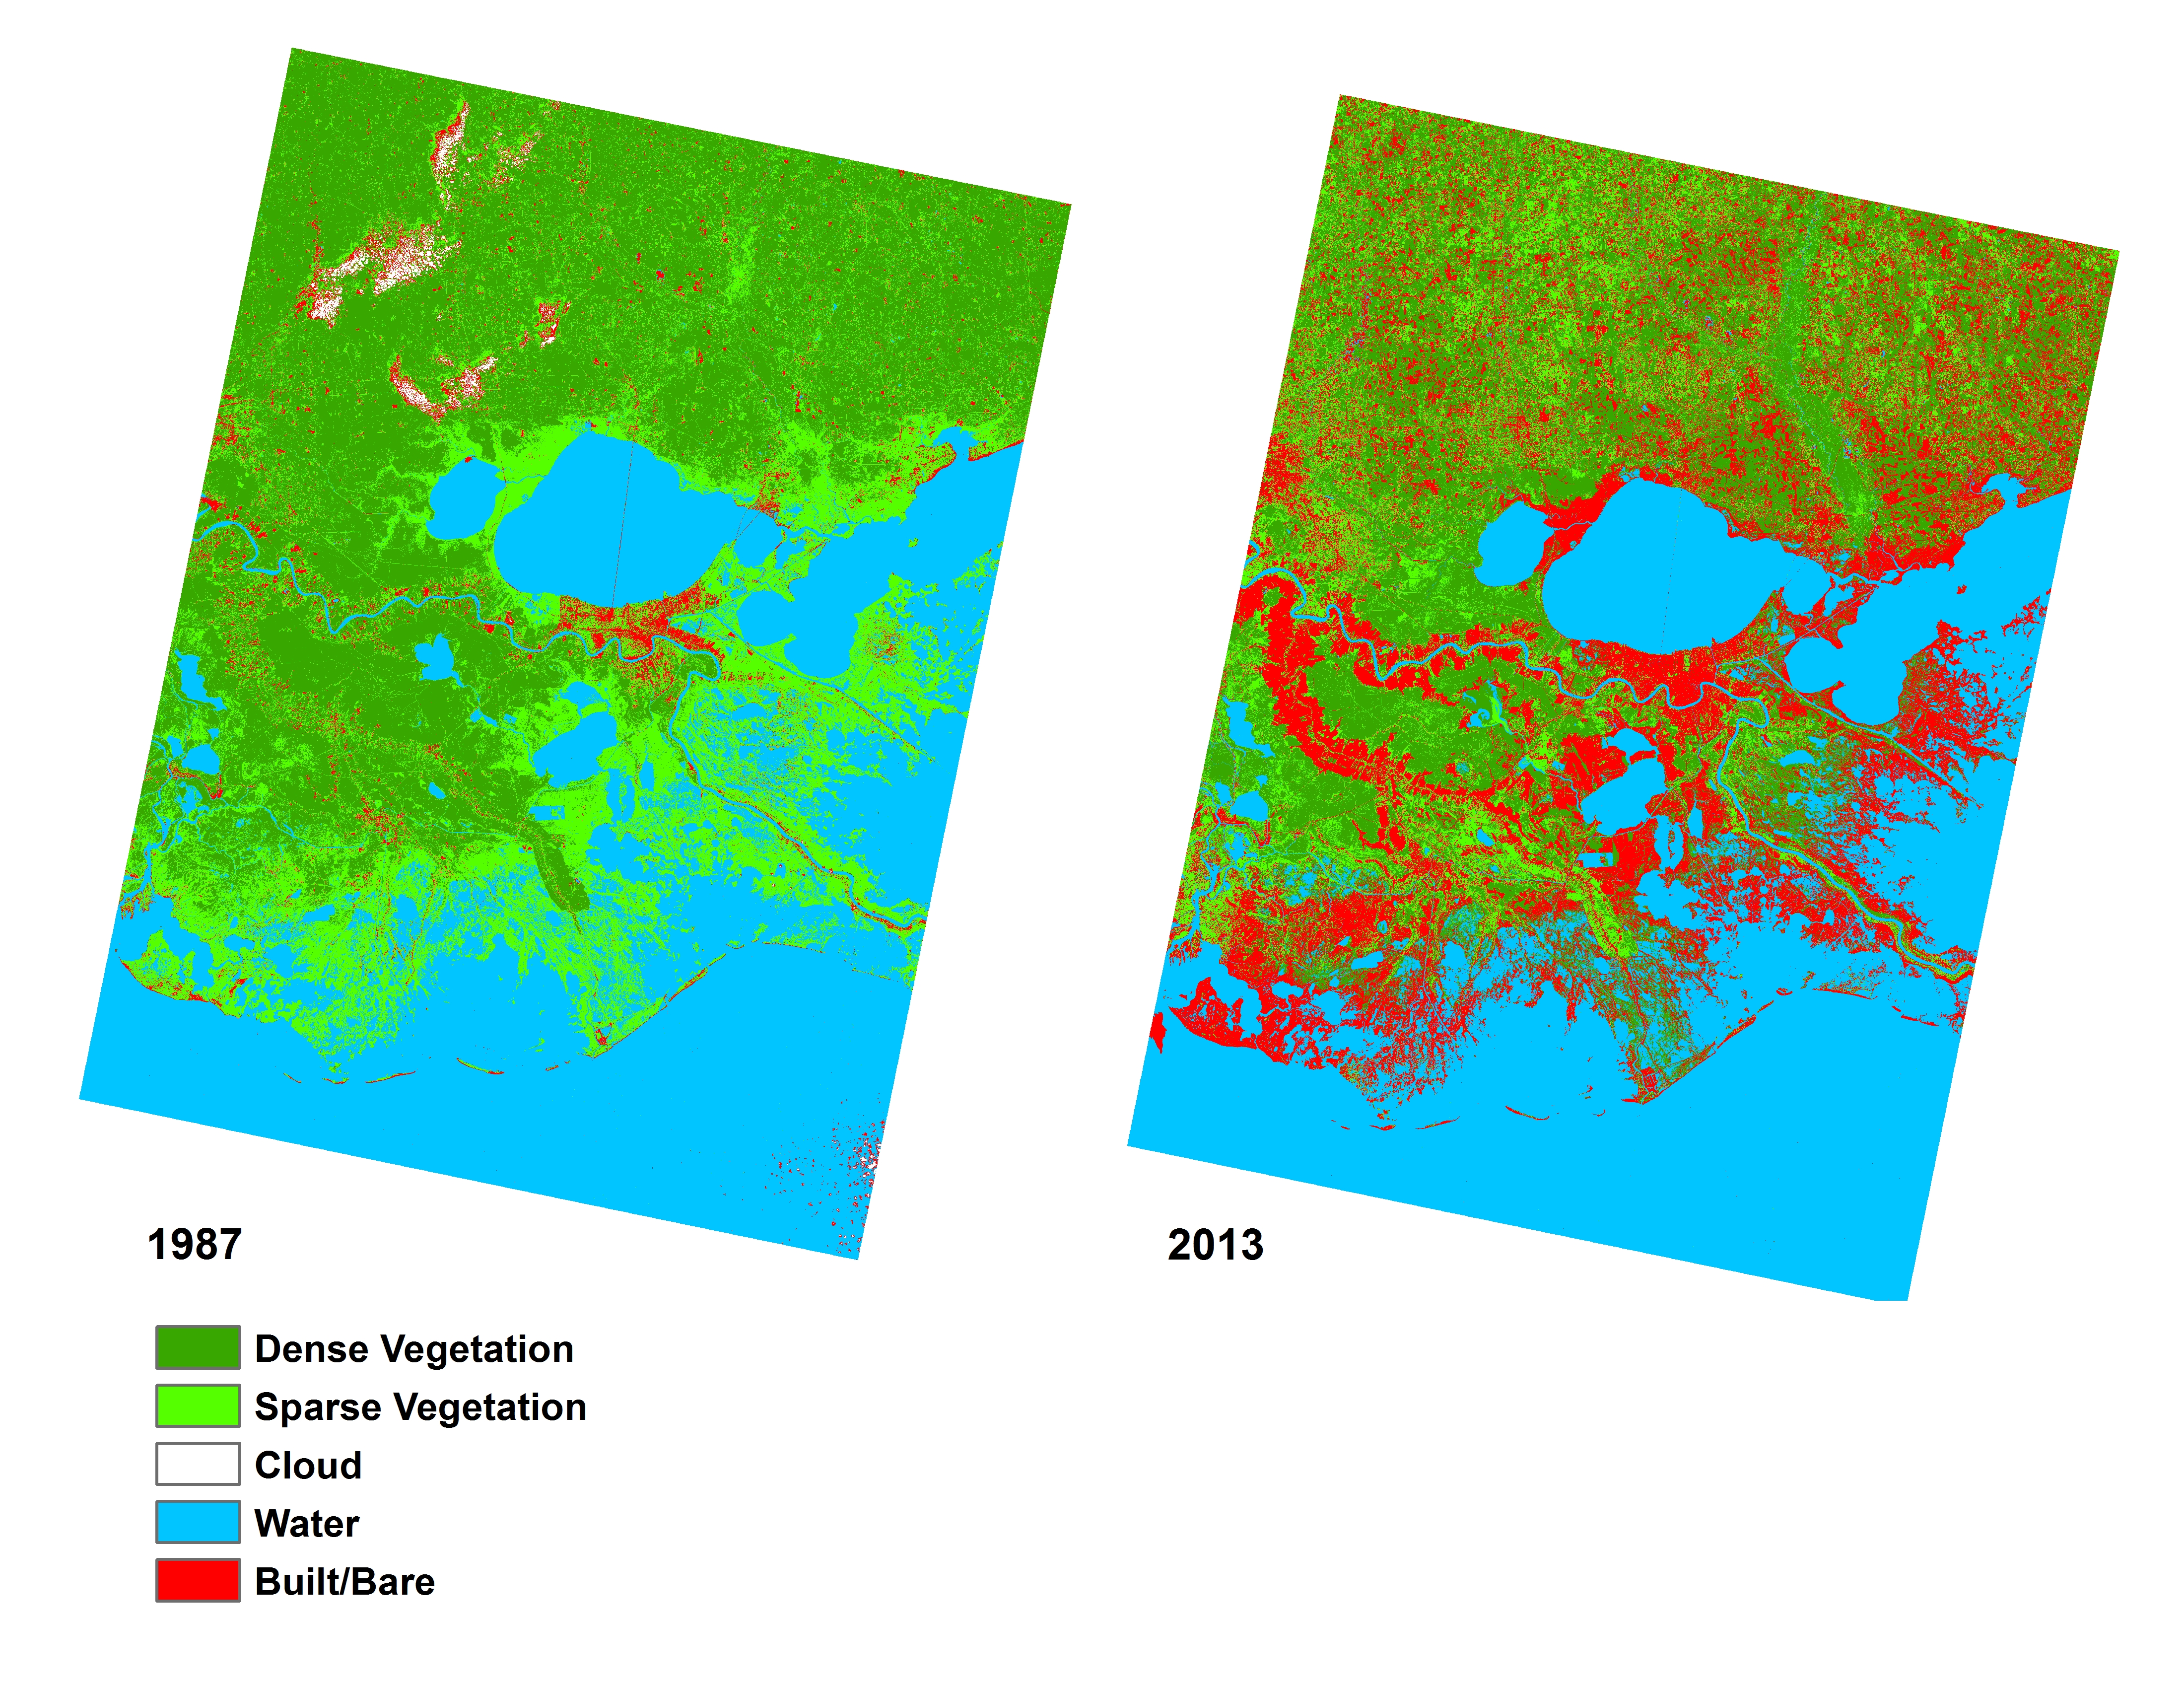
Land cover data (compatible with ArcGIS) will be provided to you in class, covering three past time periods since the 1980s. The links below will show you the approximate boundaries (as seen in Google Earth with recent years), as well as the basic changes in land cover.
view in Google Earth
Remember, in addition to Landsat-derived land cover, there are several more auxiliary geodata sets that have already been collected for you and will be provided in lab. These data include: terrain/elevation, nightlights which represent population, floristic zones, etc. and are available at all study locations. These datasets are introduced and explained further under Additional Data Sources. In addition to these ready-to-go, prepared auxiliary datasets, this page also provides ideas for additional datasets you might find on your own.